Forests play a critical role in our planet’s health, absorbing carbon dioxide, sheltering wildlife, and supporting biodiversity. Yet, to manage forests effectively—especially in the face of climate change—we first need to understand them deeply. One key challenge? Accurately distinguishing deciduous trees, which shed leaves seasonally, from evergreen trees, which keep their foliage year-round. From the ground, this is straightforward; but how do we scale up to monitor entire countries from space?
In my research, I’ve developed an innovative method that leverages Sentinel‑2 satellite imagery and harmonic analysis—a technique borrowed from sound processing—to classify French forests on a national scale.
Trees Have a Rhythm: Introducing Harmonic Analysis
Just as music can be broken down into simple notes and rhythms, the seasonal growth patterns of trees can also be decomposed into basic sinusoidal cycles. Sentinel‑2 satellites capture images of the Earth’s surface every few days, providing data over time that can be analyzed to detect these seasonal cycles. Harmonic analysis allows us to transform this data into a mathematical “song” of the forest.
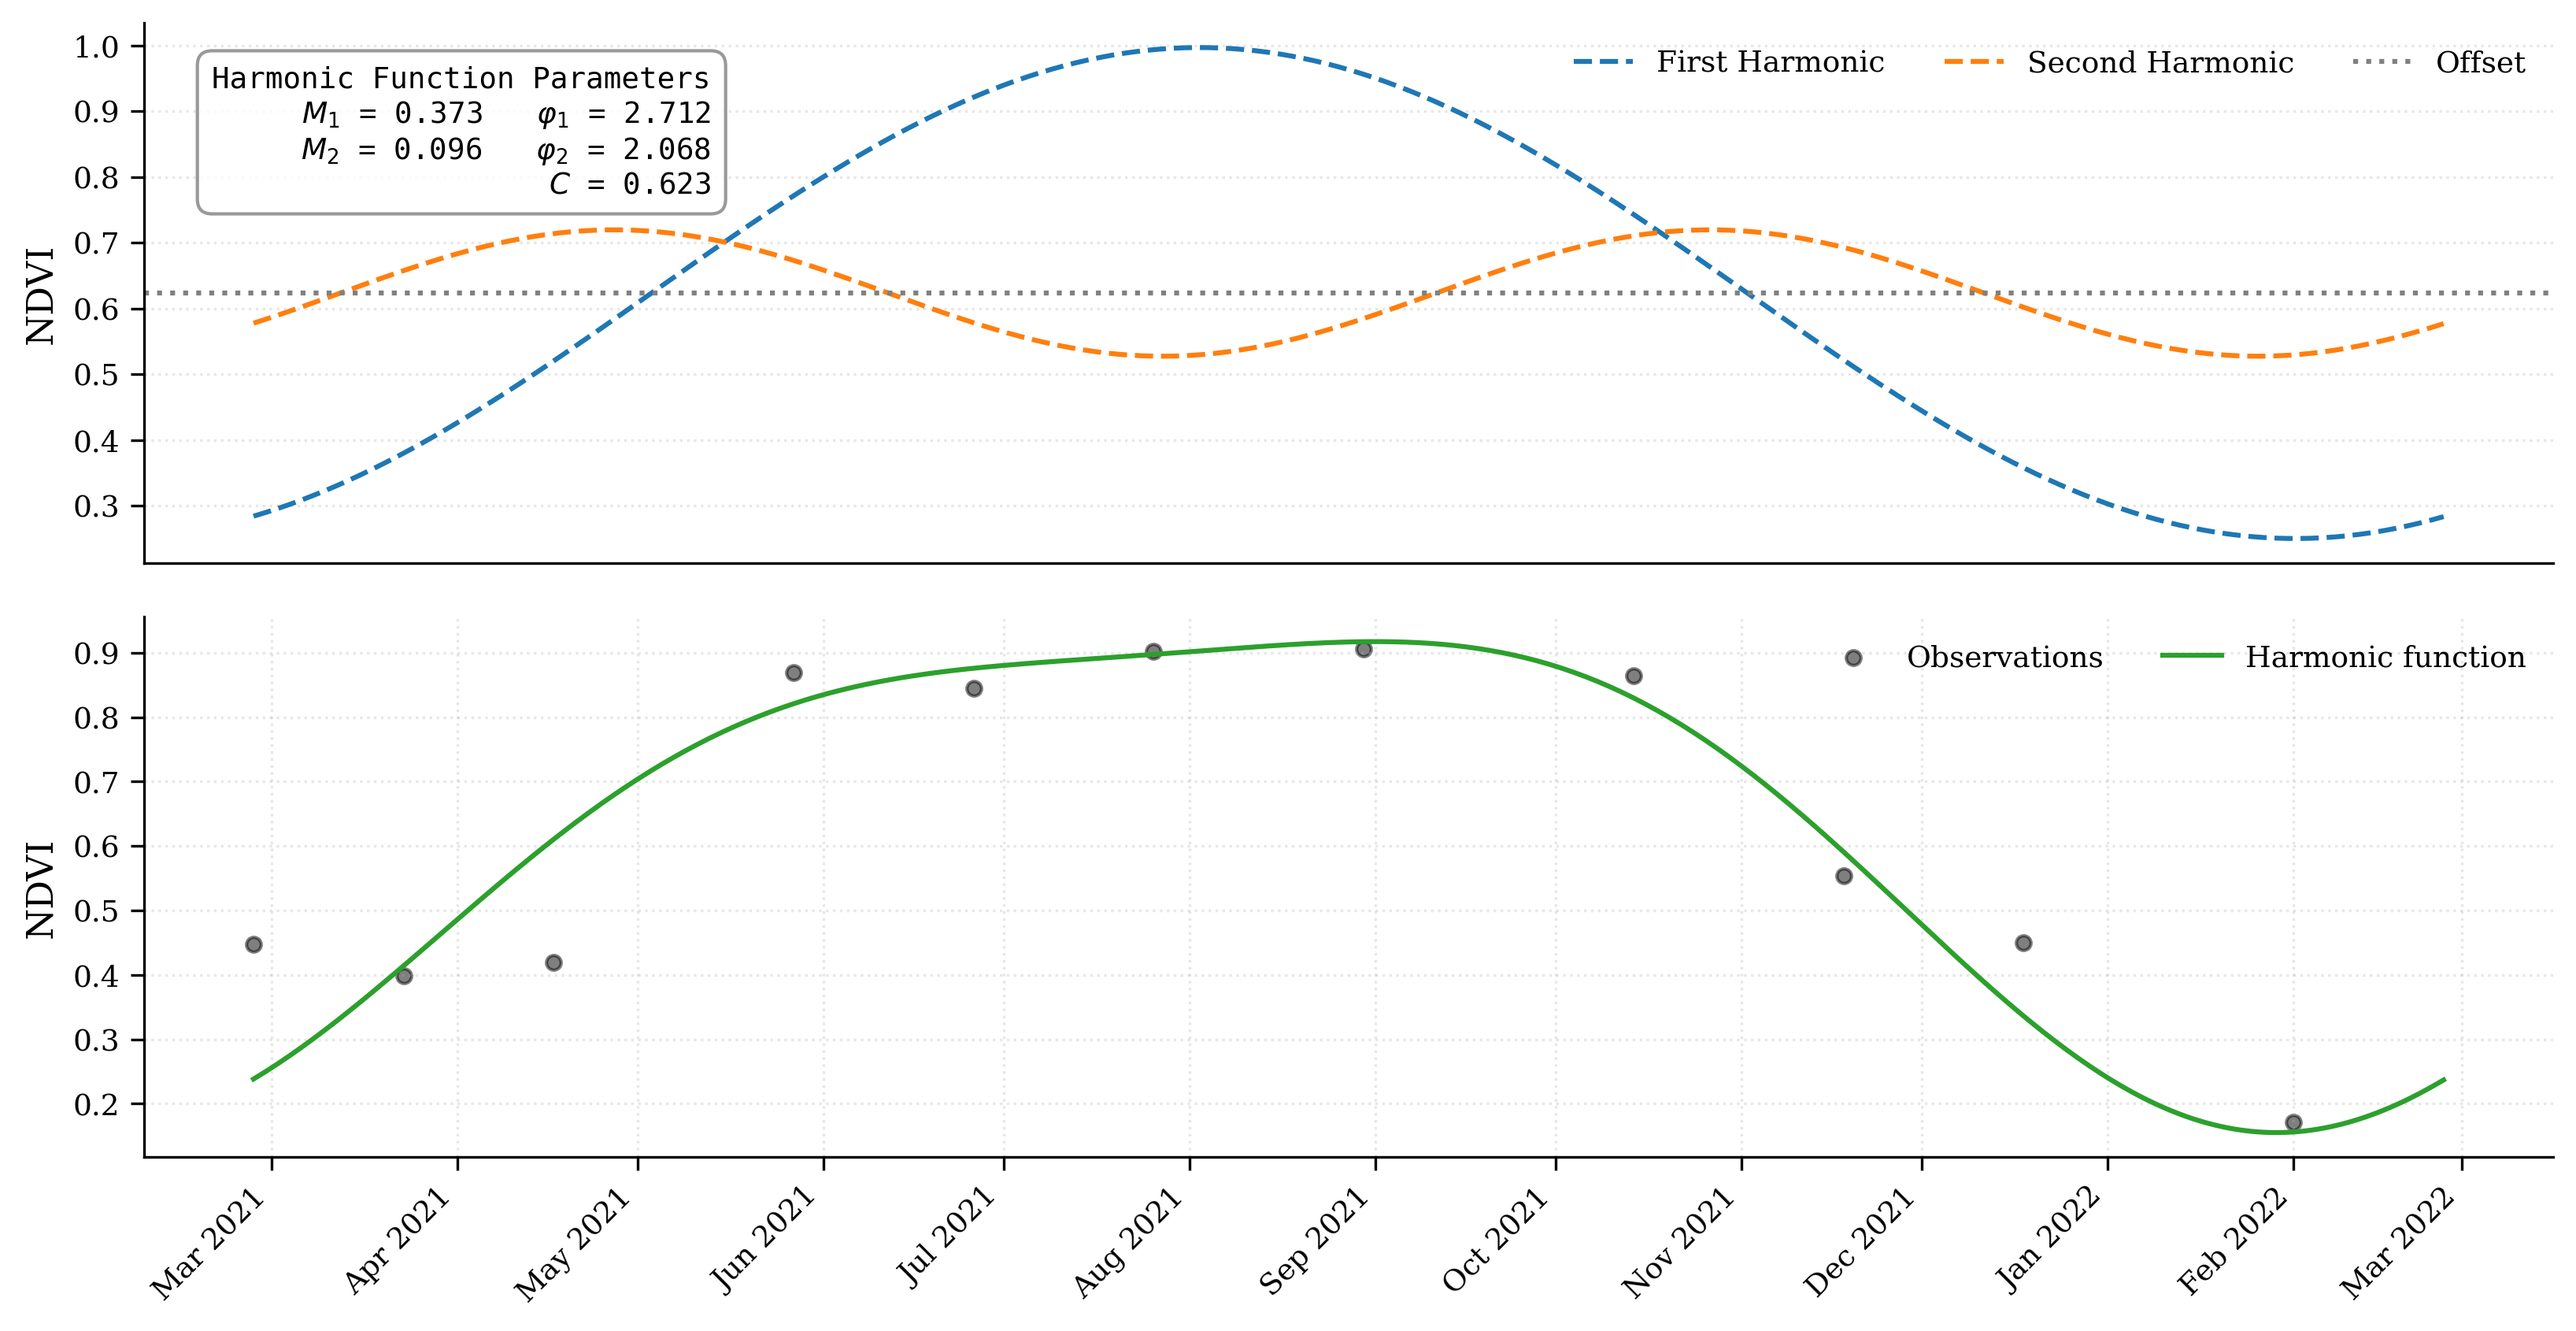
Specifically, each pixel’s vegetation signal (captured as NDVI, NBR, EVI, and CRSWIR indices) can be modeled as:
\[f_h(t) = \sum_{i=1}^{h} [A_{i} \cos(2\pi i t) + B_{i} \sin(2\pi i t)] + C\]Here:
- $t$ is normalized time across a year,
- $A_{i}$ and $B_{i}$ define the seasonal rhythm (amplitude and phase),
- $C$ is the average vegetation level throughout the year.
By analyzing these harmonic components, we can extract two essential characteristics:
- Amplitude ($M_{i}$): How strongly vegetation varies within a year, typically larger for deciduous trees.
- Phase ($\phi_{i}$): When the vegetation peaks, which helps differentiate species based on their growth timing.
Think of the first harmonic as the primary melody—a clear annual leaf‑on, leaf‑off cycle in deciduous trees—and the second harmonic as subtle variations, refining our understanding of more nuanced seasonal behaviors.
Turning Satellite Data into Forest Maps
My approach involved processing Sentinel‑2 images into consistent monthly mosaics across France, covering year 2023. Using harmonic analysis, each pixel was transformed into a set of features reflecting its unique seasonal pattern. These features then fed into a machine learning algorithm (Random Forest) trained on extensive ground and aerial survey data.
Key steps included:
- Optimizing harmonic components: Two harmonics balanced capturing accurate seasonality without overfitting noisy signals.
- Robust feature selection: Identified the most informative indices (NBR, NDVI, EVI, CRSWIR) and harmonic features (primarily first harmonic) to ensure efficient and accurate classification.
- Efficient computation: Parallelized processing on high‑performance computing infrastructure, allowing nationwide analysis within an hour.
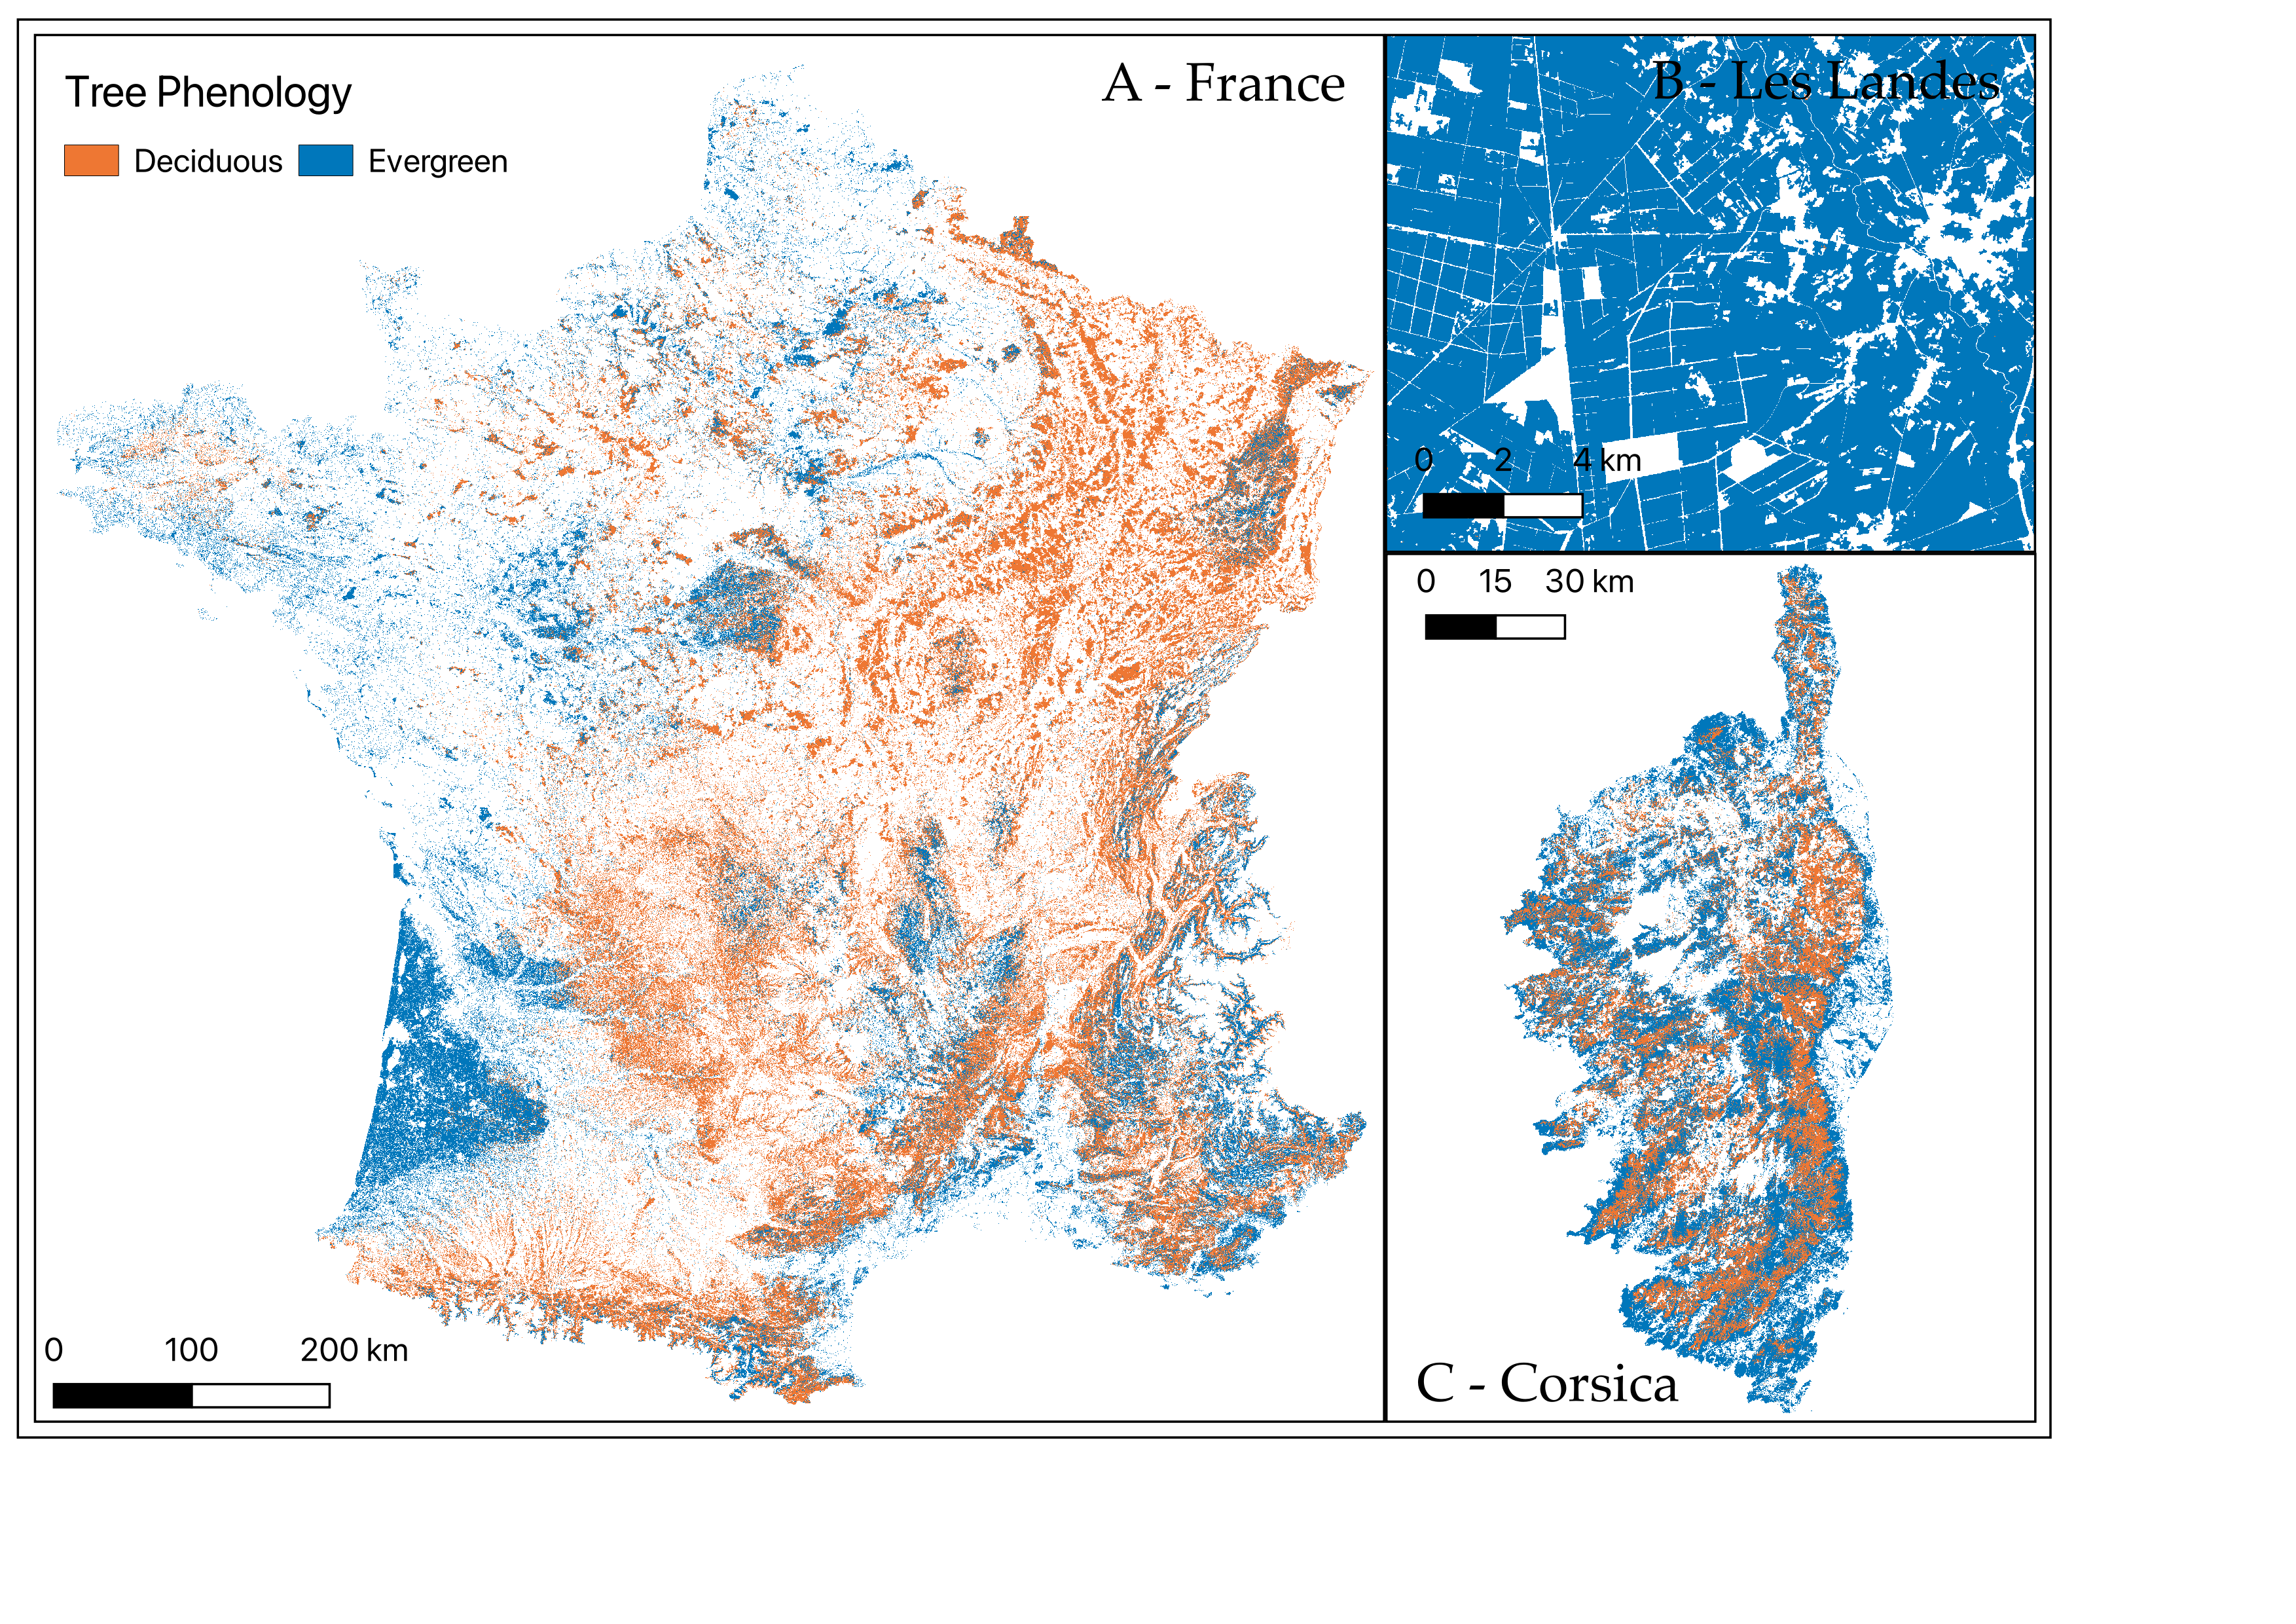
What the Forest Map Tells Us
The resulting map vividly distinguishes France’s deciduous and evergreen forests with remarkable clarity. The classification achieves a robust overall accuracy (weighted F1‑score) of 96%, confirming the efficacy of harmonic analysis.
Some key insights emerged:
- Deciduous forests dominate in northern and central France, clearly reflecting seasonal leaf cycles.
- Evergreen forests, like the expansive pine plantations of Les Landes, show consistent year‑round foliage patterns.
- Mediterranean and mountainous areas posed greater classification challenges due to complex seasonal behaviors and varied terrain.
Comparing my map to existing products, such as the Copernicus Dominant Leaf Type and BD Forêt v2 datasets, reveals improved accuracy and more detailed regional nuances. For example, mixed forests and mountainous regions are more precisely represented due to harmonic analysis’ sensitivity to subtle seasonal differences.
The Bigger Picture: Why This Matters
Understanding forest phenology from space isn’t just academically interesting; it’s critical for practical forestry management, climate modeling, and biodiversity conservation. My method provides a reliable, scalable approach that could be replicated globally, enabling consistent forest monitoring.
Potential future applications include:
- Detecting early signs of climate‑induced stress or shifts in tree phenology.
- Monitoring recovery and resilience after forest fires or droughts.
- Identifying invasive species or shifts in dominant tree types due to climate change.
Looking Ahead
While the current model performs well, further improvements could include integrating complementary data, such as LiDAR or radar, to better capture structural forest changes or subtle phenological shifts. Additionally, continuous near‑real‑time updates could soon become feasible, providing forest managers and conservationists timely insights.
Conclusion
By “listening” to the seasonal rhythms of trees using harmonic analysis, we gain unprecedented insights into forest dynamics from space. This approach not only advances ecological science but also offers practical tools to sustainably manage and protect our planet’s vital forests.